The major points that we wanted to cover with this project are:
- Integrate many of the things we learned over the course of the semester into one project
- Discover new ways to process and interpret data
- Speed up a normally software-oriented calculation in hardware
We felt that the best way to do this would be to implement a relatively complex calculation on an FPGA and display the results of that calculation on a monitor via VGA. Then by taking a specific portion of interest in the data and displaying it in a more meaningful fashion, we could also play audio frequencies that correspond to the calculated data.
In terms of the calculation itself, we chose elementary cellular automation because of the multiple different ways that a single starting point can be iterated upon to give interesting results. While it is the simplest form of cellular automation, it has shows powerful capabilities in fields like random number generation and universal computation. (see our page on elementary cellular automation here: http://elec444sp15ec3a.blogs.bucknell.edu/elementary-cellular-automation/)
This calculation would be considerably sped up by hardware due to the number of different comparisons that need to be made between cells. By creating enough hardware registers to store every possible cell that we would need in calculating a 64×32 we don’t need to constantly read and write from RAM like a processor normally would. Also, writing from hardware registers straight into BRAM blocks for VGA display and Pmod amplification is much faster and simpler to implement than calculating the cells in software and connecting the processor to the BRAM blocks.
In terms of how the project itself flows logically, here is a block diagram to graphically explain at a high level. In other pages we will have lower level block diagrams describing each of these blocks.
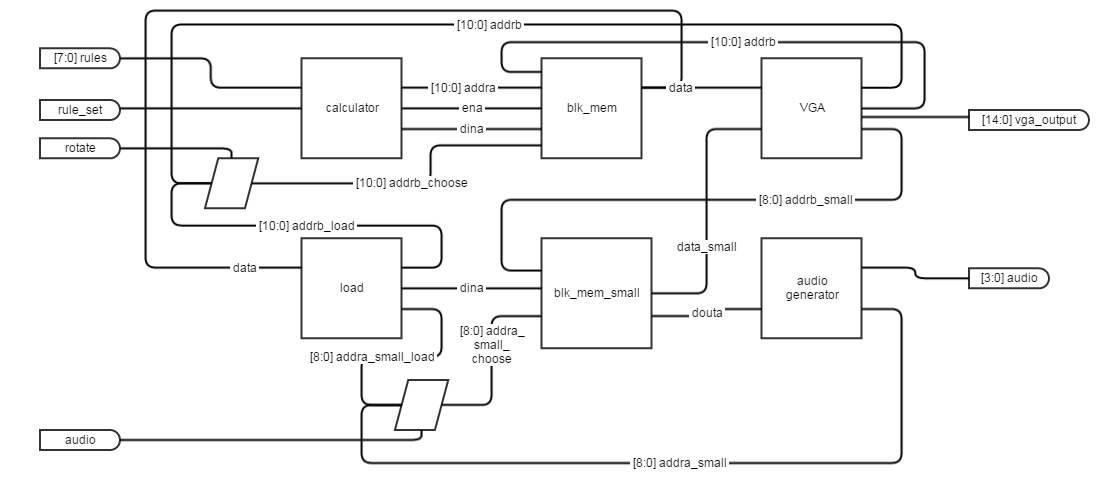
After a rule is selected for automation, the Calculations block determines the first 32 generations of that rule with a single block in the middle of the first row in generation 0. Once every generation has been stored in the output array, the cell values are written into a BRAM one cell at a time and once every clock cycle. From there, the BRAM will display the final 64×32 array on the monitor.
Pressing the rotation button selects the center of the array, rotates the selected columns 90 degrees counter-clockwise and plays musical notes at frequencies that are dependent on how the black and white blocks are configured vertically in the rotated array. Once the music is finished playing, the reset button will allow for a user to input a new rule and recalculate the automation without having to reprogram the board.